
Maps! Coloring! Voting!
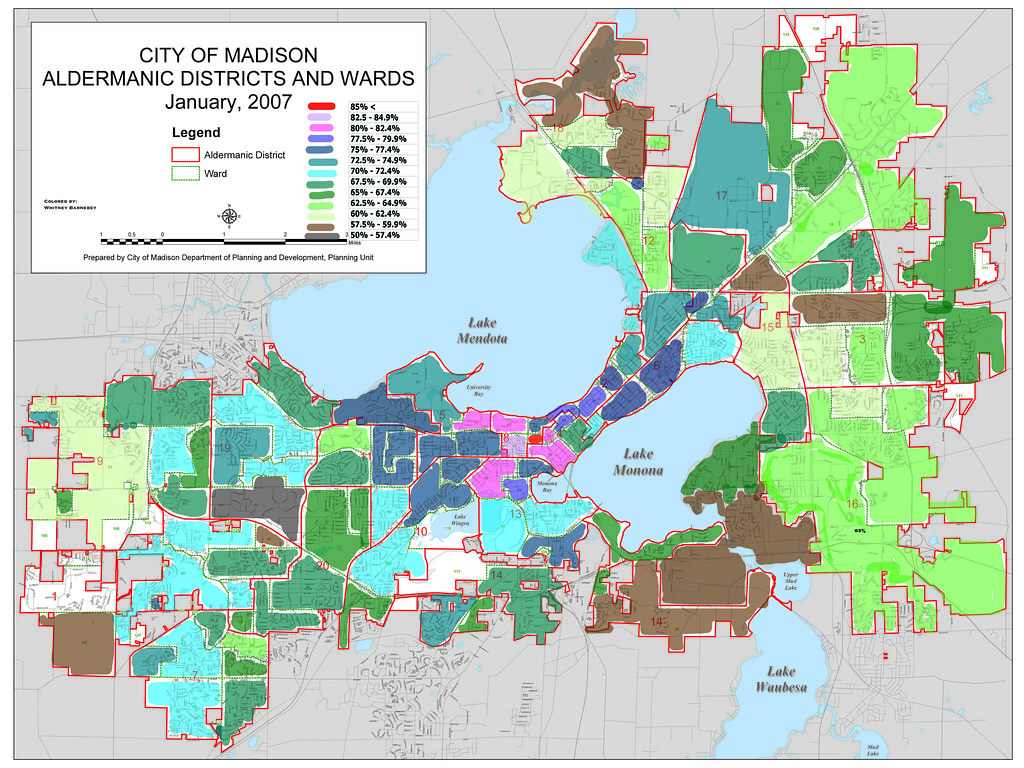
Today I present to you a map. One might be tempted to call it a mash-up, but that would imply that there was something technological about. Or maybe that Google was somehow involved. Neither of those is true. What it is is a map of the election wards in Madison (plus Monona, Shorewood Hills, and Maple Bluff), color coded by the percent of the Democratic vote Obama got yesterday, according to the Dane Country Clerk's Office. There's nothing really surprising about this map, except maybe that Obama actually won every single ward in the metro area, and that Maple Bluff was so heavily Obama-ian. I expected more establishment out of them.
I wish I could have cross-referenced this data with voter turn out percentages for Tuesday. Especially since Tommy claims to live in the most civically active ward in the city [state], and I'd like proof of that before I believe him. Unfortunately, that information proved impossible to obtain.
![]()

3 comments:
What does that even mean?
If you'd give me a second to finish writing my post you wouldn't have to ask.
I believe that ward 35 actually has the highest % turnout in the entire state. I might be wrong...nope, no I'm not. And no, I don't have the proof...yet. I'm just always right.
Post a Comment